To extract information from data, a wide variety of data mining techniques are employed.
These include:
->classification
->clustering
->association rule learning
->regression
->anomaly detection
->sequential pattern mining
Depending on data characteristics, batch or real-time processing can be used. The first one works for big amounts of data collected over a certain period. Real-time processing applies to systems with dynamically updated data, the example of which is Google Analytics real-time overview report that reflects the website user activity happening here and now.
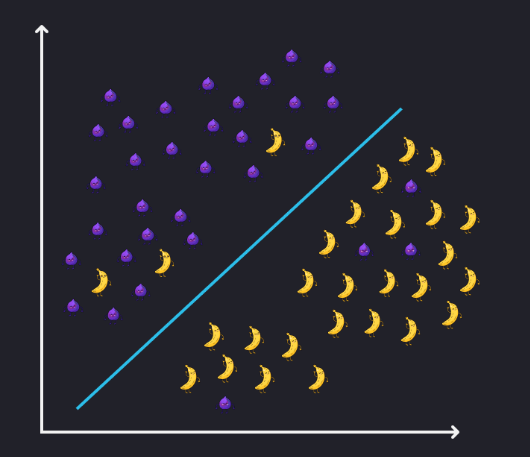
Classification
Classification is used to divide data into predetermined groups or classes. This data mining technique determines the class to which a record belongs based on the values of several attributes. The goal is to sort data into predefined classes. Most commonly, classification involves predicting a target variable that can take on one of two or more possible values (e.g., spam/not spam; positive or neutral/negative review) given one or more input variables called predictors.
Clustering
Clustering is a technique for grouping related entries in a database into clusters based on their similarities. Whereas classification assigns variables into known categories, the clustering technique first singles out these clusters in the dataset and then groups variables based on their characteristics.
For example, you can cluster customers into groups according to the sales data – those who regularly buy pet food or specific drinks and who are stable in their preferences and customer behavior. Once you establish these clusters, you can easily target them with customized advertisements.
Clustering has a wide range of applications:
->medical diagnostics
->computational biology
->text mining
->web analytics

Association rule learning
Association rule learning discovers if-then patterns between two or more variables. The simplest example is the association between buying bread and butter. People that buy bread usually get butter with it, and vice versa. That is why you will find these two products close to one another in a grocery store.
However, the link may be not that direct. For instance, in 2004 Walmart discovered that the sales of Strawberry Pop-Tarts were at their peak before the hurricane. People stocked up not only the necessities like batteries but also these popular desserts. In retrospect, the psychological motivation is quite obvious: during emergencies, your favorite food gives you a sense of security, and tarts with a long shelf life are a perfect option. But to determine this relationship, it was necessary to apply data mining techniques.

Regression
Regression establishes a relationship between variables. Its goal is to discover the right function that describes the relationship. If a linear function (y = ax + b) is used, the process is called linear regression analysis. For other types of dependencies, methods such as multiple linear regression, polynomial regression, etc. can be used.
Its most common application is planning and modeling. One example is forecasting customers’ age based on their purchase history. We can also predict costs based on such variables as consumer demand – for example, a surge of prices on the secondary market due to the increased demand for cars in the US.
Anomaly detection
Anomaly detection is a data mining technique used to identify outliers (values that deviate from the norm). For example, in e-commerce datasets, it can detect unusual sales during a given week at a store location. Among other things, it can be used to discover credit or debit fraud and identify intrusion or interruption in the network.